A series of graphics produced by BuildZoom chart housing production in the Greater Los Angeles area between 1940 and 2016, showing the spread of developments large and small across Southern California. The materials highlight the slowing pace of construction over the decades, and illustrate how the affordability crisis that now grips the region took shape.
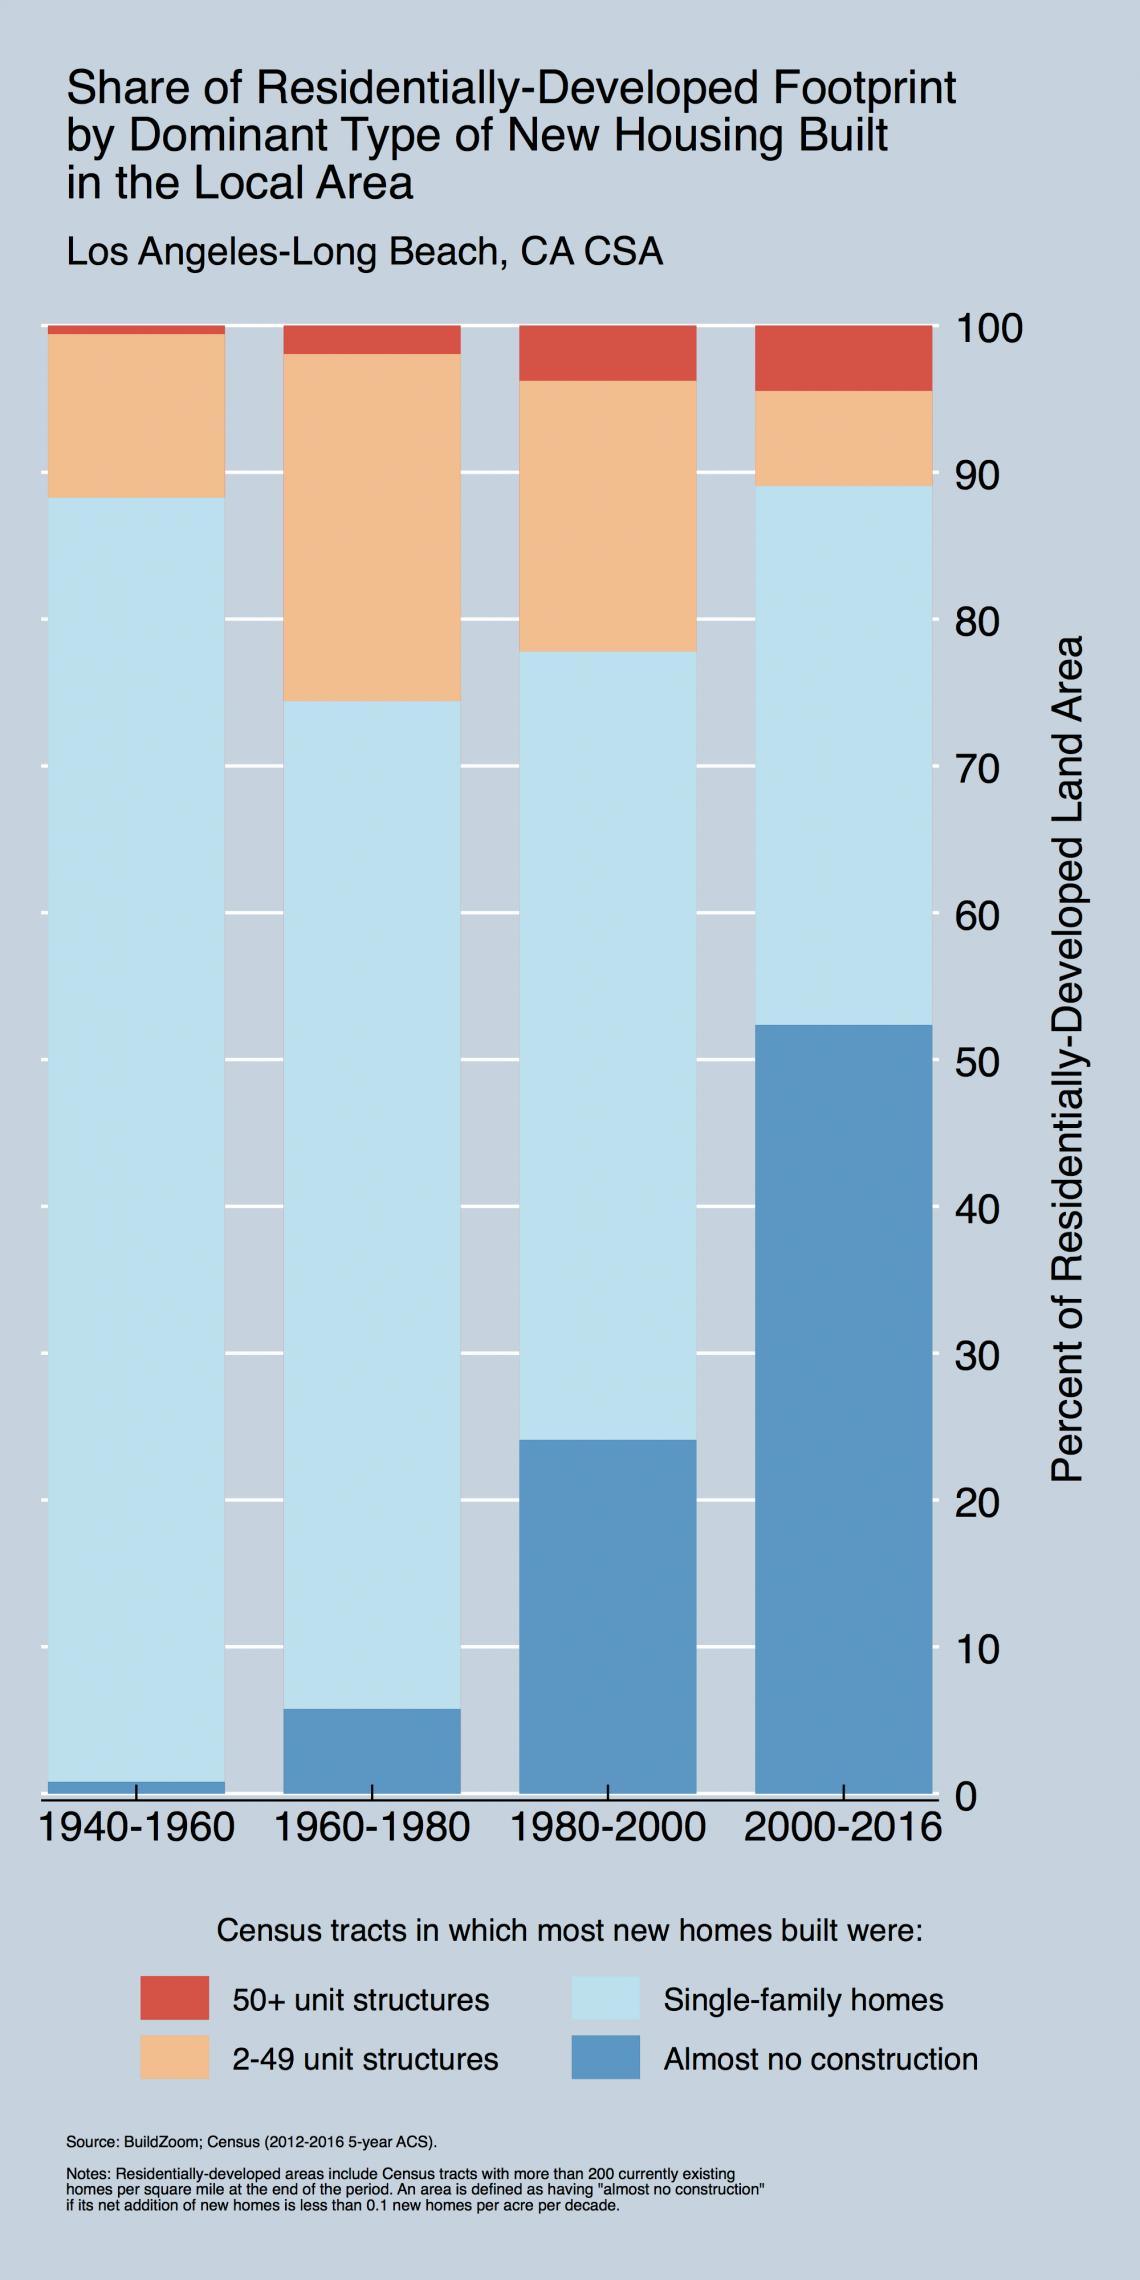
The maps distinguish between three housing types - single-family residences, 2 to 49 unit structures, and 50+ unit structures - which are assigned the colors light blue, orange and red respectively. A fourth color - dark blue - is set aside for areas that either produced no new housing or did so at a negligible pace.
1940-1960
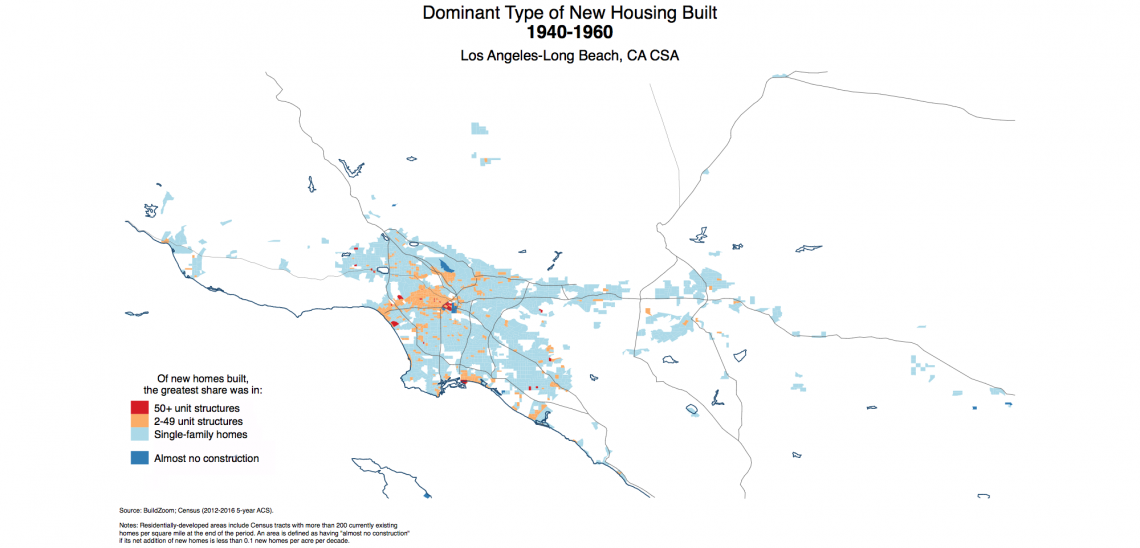
During the 1940s and 1950s, Los Angeles underwent a dramatic period of growth in which the majority of the region saw significant housing construction. Southern California's reputation for low-rise, low-density development was cemented in this time period, with single-family residences proliferating throughout Los Angeles, Orange, Riverside and San Bernardino Counties.
Significant swaths of orange and red to indicate some modest densification in certain pockets of the region, including Long Beach, Burbank, Glendale and the Wilshire - Santa Monica corridor.
1960-1980
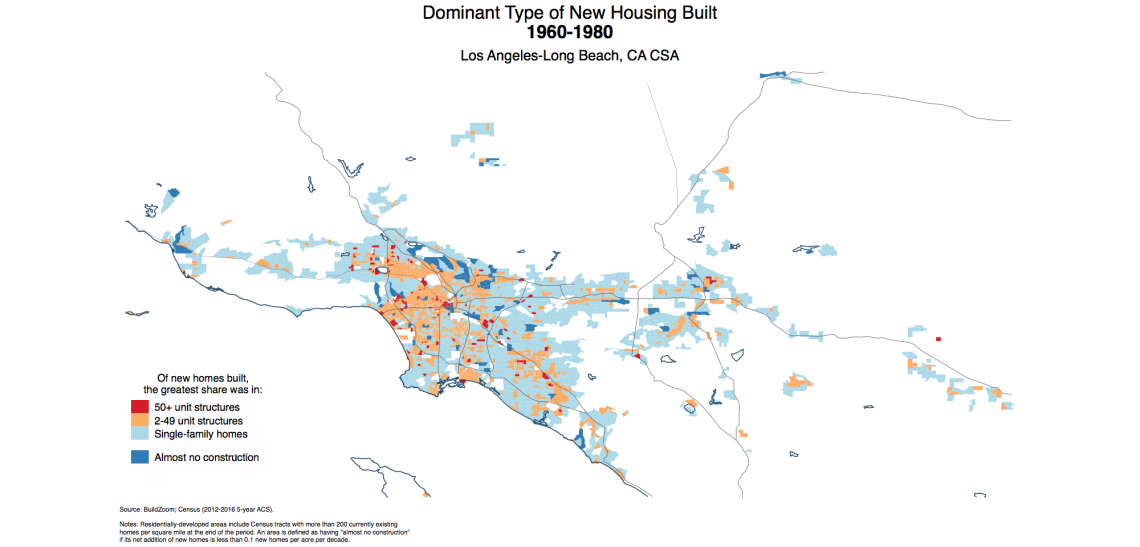
Through the 1960s and 1970s, most new construction still consisted of single-family residences, but mid-sized residential developments began spreading through the South Bay and into the San Fernando Valley.
Larger projects featuring 50 or more residential units continued to rise in existing nodes such as Downtown Los Angeles, but also became more common in secondary nodes such as the West Valley and the Mid-Wilshire area
1980-2000
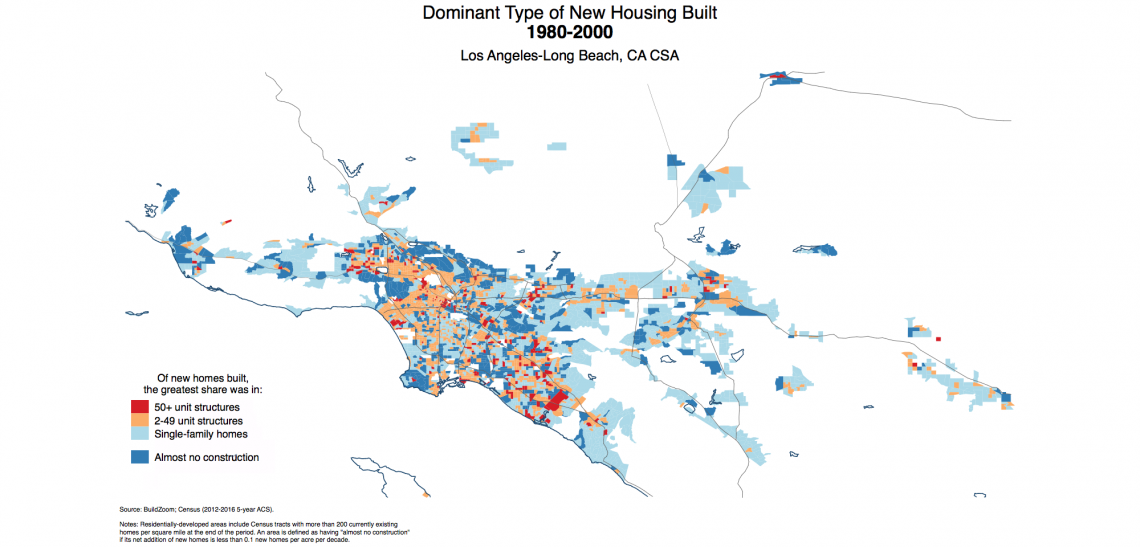
During the 1980s and 1990s, the slowdown in housing production is apparent through the spread of dark blue areas throughout the map - highlighted by wealthy hillside communities in the South Bay and the Westside.
Larger developments became much more prevalent during these two decades, with a high concentration in Orange County.
Single-family construction continued to lose ground over these two decades, although communities of tract homes continued to appear in exurban locales in the in the northern and eastern parts of the region.
It is important to note that the Los Angeles economy fell into doldrums during this period, as the cessation of the Cold War struck a powerful blow to the region's aerospace sector.
2000-2016

The most recent map, showing development between 2000 and 2016, paints a familiar picture to those who have followed regional housing construction. The bulk of Southern California - already built out with single-family tract homes - produces negligible amounts of housing.
The bulk of new homes are produced through larger 50+ unit developments, concentrated in Orange County, Downtown Los Angeles, the Wilshire-Santa Monica Corridor and the San Fernando Valley.
BuildZoom's analysis concludes that single-family homes continue to dominate the region's footprint, accounting for 36.7 percent of the metro's total area and for 62.3 percent of new home production. At the same time, the number of moderately-sized multifamily developments have sharply decreased in total share of housing production, peaking at 23.7 percent between 1960 and 1980, and declining to just 6.5 percent today. Dense construction has spread significantly since the mid-20th century, and now accounts for 13.8 percent of total housing production despite occupying a modest 4.5 percent of the regional footprint.