For years, developers have blamed Los Angeles' convoluted real estate entitlement process for the region's housing crisis. A recently launched real estate intelligence platform, by a former City Hall insider and a GIS analyst, hopes to address this problem by allowing investors to cut through the red tape and identify suitable properties more quickly.
The program, dubbed Pactriglo, began development in early 2016 and launched publicly July 2017 sources data from four different public agencies, then uses that information to compile a searchable database which can identify properties according to zoning, utilization, secondary zoning, and building construction activity.
Its creators Benjamin Pezzillo and Robert Lega note that in any given year, the Los Angeles Department of City Planning receives twice the number of applications that it can complete, creating a bottleneck in the development process. Applications for items requiring discretionary approvals - such as a zone change - can result in an entitlement process lasting two-to-six years with no guarantee of success.
Projects requiring discretionary entitlements will never provide sufficient volume to address the regional housing crisis. Instead, the city needs a method to maximize existing zoning under current municipal law.While projects requiring discretionary entitlements have recently become a major source of new housing in Los Angeles, Pezzillo and Lega argue that the long, politically fraught process means that these developments will never provide sufficient volume to address the regional housing crisis. Instead, the city needs a method to maximize existing zoning under current municipal law.
Pactriglo's utility is its ability to search for properties by zone, something that the City of Los Angeles' own systems - ZIMAS, NavigateLA and LADBS - are incapable of doing. For example, the program allows one to pinpoint each of the 11,000 R4 properties that meet the currently-required minimum lot area. One may also find the more than 30,000 C2 zoned properties throughout the city, which also allow by-right R4 uses.
Steven’s Take
In trying out Pactriglo for myself, I was struck by key differences with its most direct counterpart under the City of Los Angeles' umbrella: ZIMAS. Though an indispensable tool for anyone working in real estate or planning, ZIMAS can hardly be considered user-friendly. Its target audience is city employees, and thus there is little effort to curate its data for developers. To analyze a property via ZIMAS, one needs to identify all relevant zoning information, then interpret that data to determine what can be built on a property. With Pactriglo, there is no need for research or interpretation. If you click on a property, the program tells you exactly what can be built there.
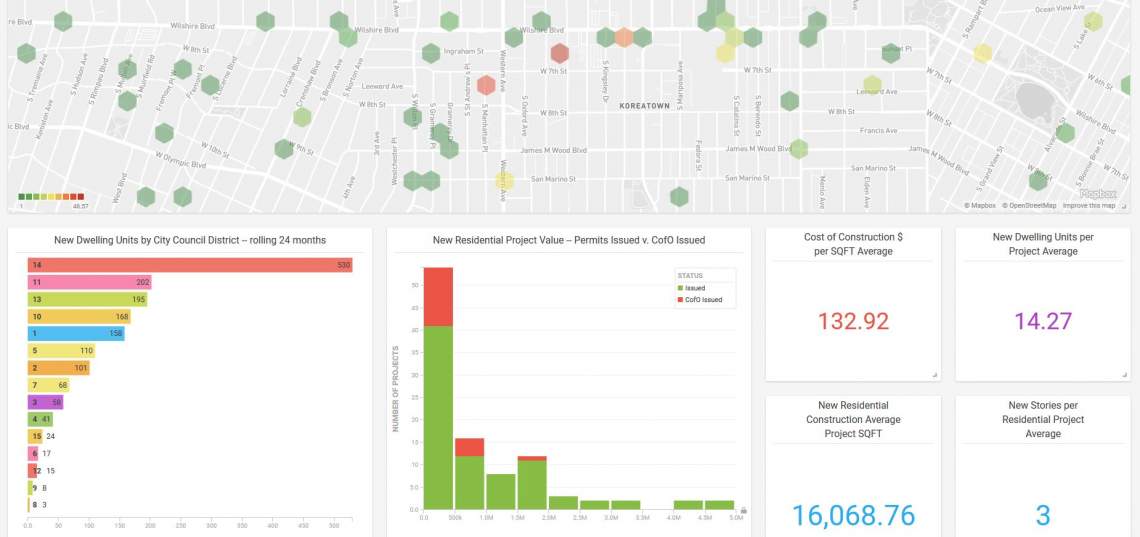
The program also provides information that is tailored specifically for investors, including 1) which properties are underbuilt to zoning and to what extent 2) estimated land values and construction costs based on LADBS data.
None of this is to dispute the continuing utility of City-controlled platforms like ZIMAS or NavigateLA, which are important tools that provide direct access to relevant policy documents.
Chris’ Take
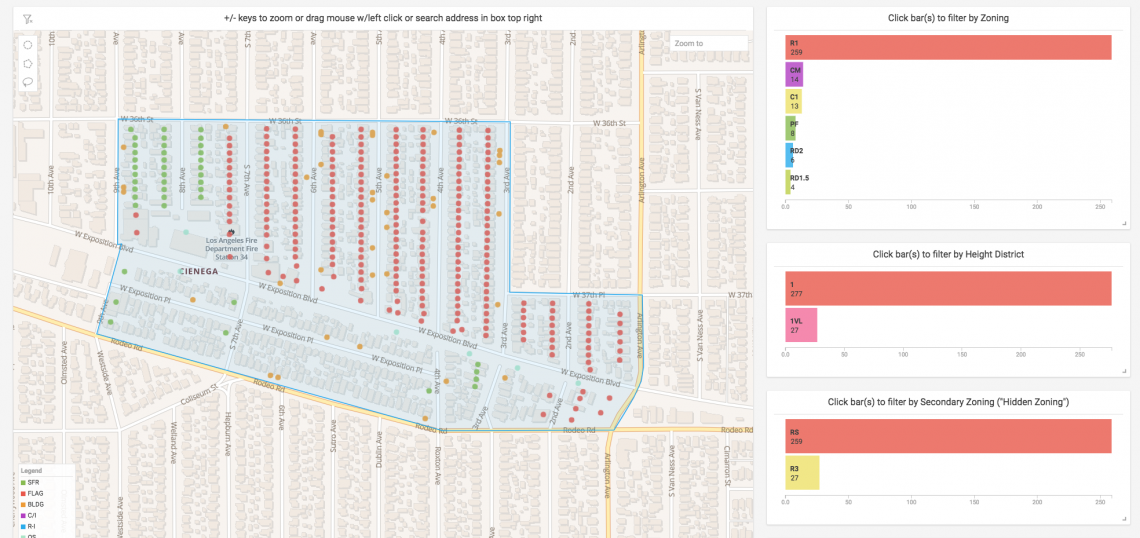
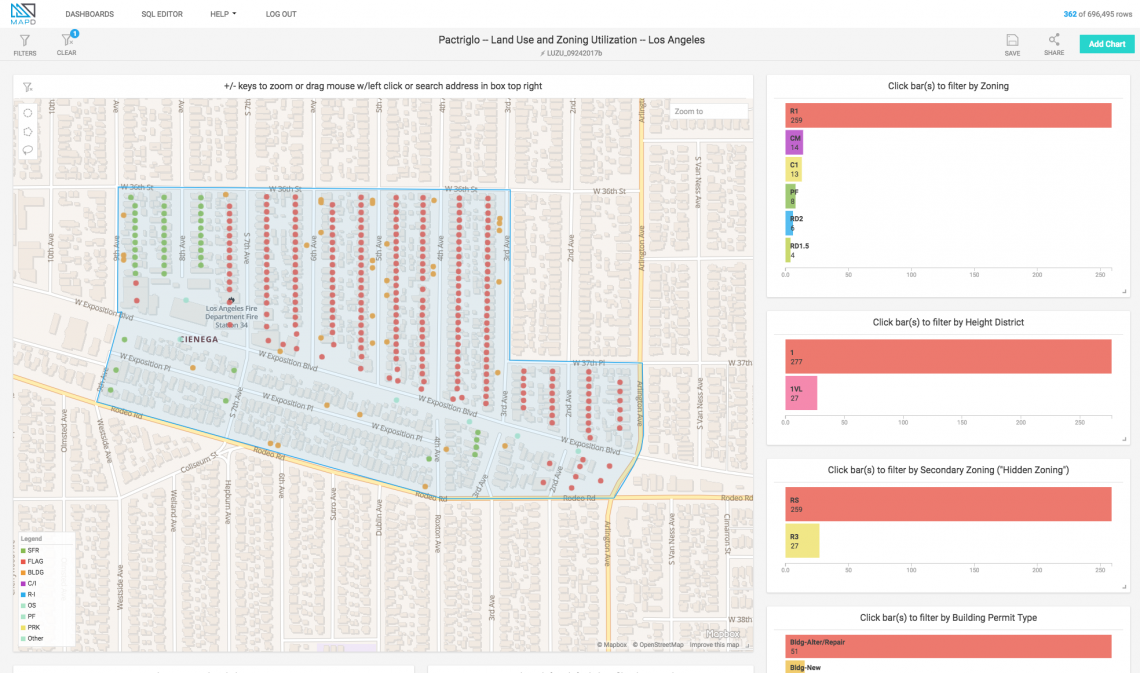
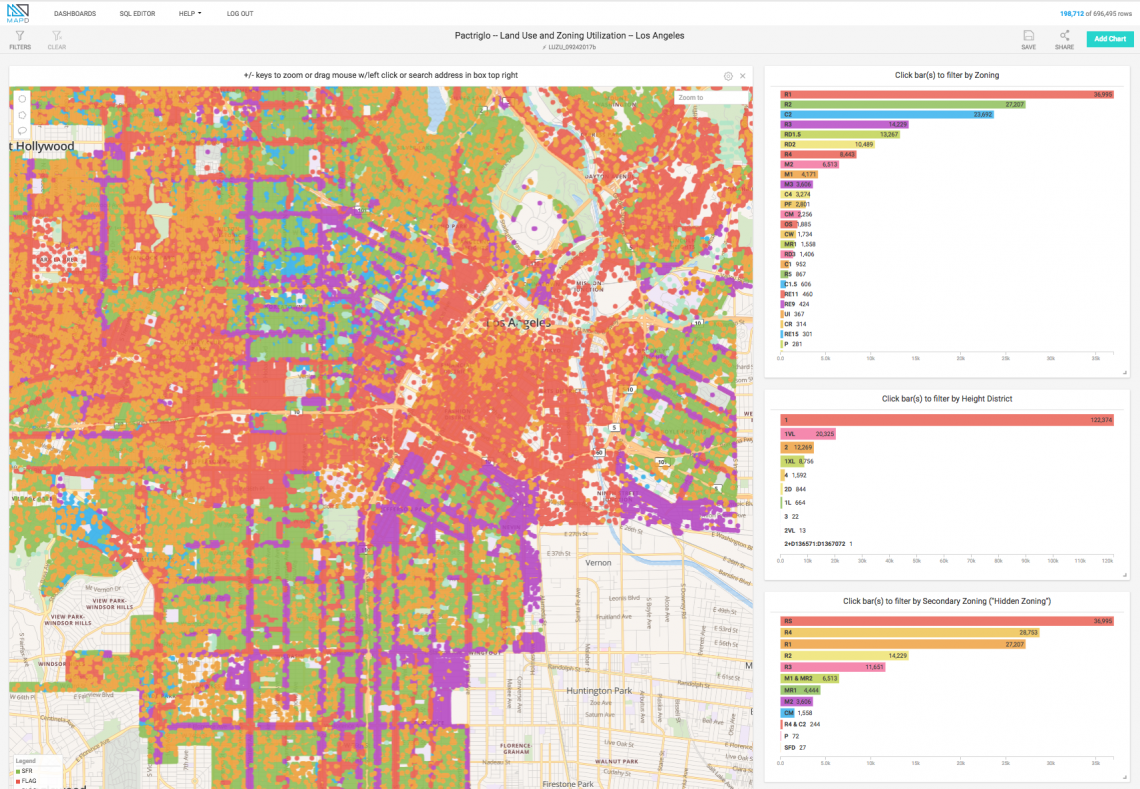
My initial impressions using Pactriglo were positive. The map view takes center stage, with several bar charts around it illustrating the distribution of zoning, height districts, permits, and utilization of the parcels currently being viewed.
The UI feels snappy, and I never found myself waiting for data to load. The default dashboard was clearly not intended for my 21:9 monitor, but I found that I could resize windows to any arrangement I wanted by click-dragging. In the future, it would be nice if the developers added responsive dashboards that shift their arrangement automatically to accommodate ultrawide, tablet and smartphone displays.
Getting around Pactriglo is a pleasantly intuitive experience, especially compared to a tool like ZIMAS. When I entered an address in the search bar, the map smoothly zoomed to it Google Maps-style, with pins on each building illustrating top-level zoning categories and other attributes.
Using the polygon tool, I circumscribed several blocks and watched the charts instantly update to limit the data to my selected area. Then, using the parcel size chart I filtered by Instantly, the map highlighted the 2 parcels above this threshold, and the other charts updated to only display data from those parcels.
I was also pleased to see options available to save the state of my dashboard and to share it with another user. Good stuff.
Conclusion
Pactriglo is a well-needed and much-welcomed tool for professionals in LA’s real estate development world. We wouldn’t be surprised if the product even winds up being used by DCP and other city agencies. We’ll be keeping an eye on Pactriglo, and we look forward to seeing what features they add as the product evolves.